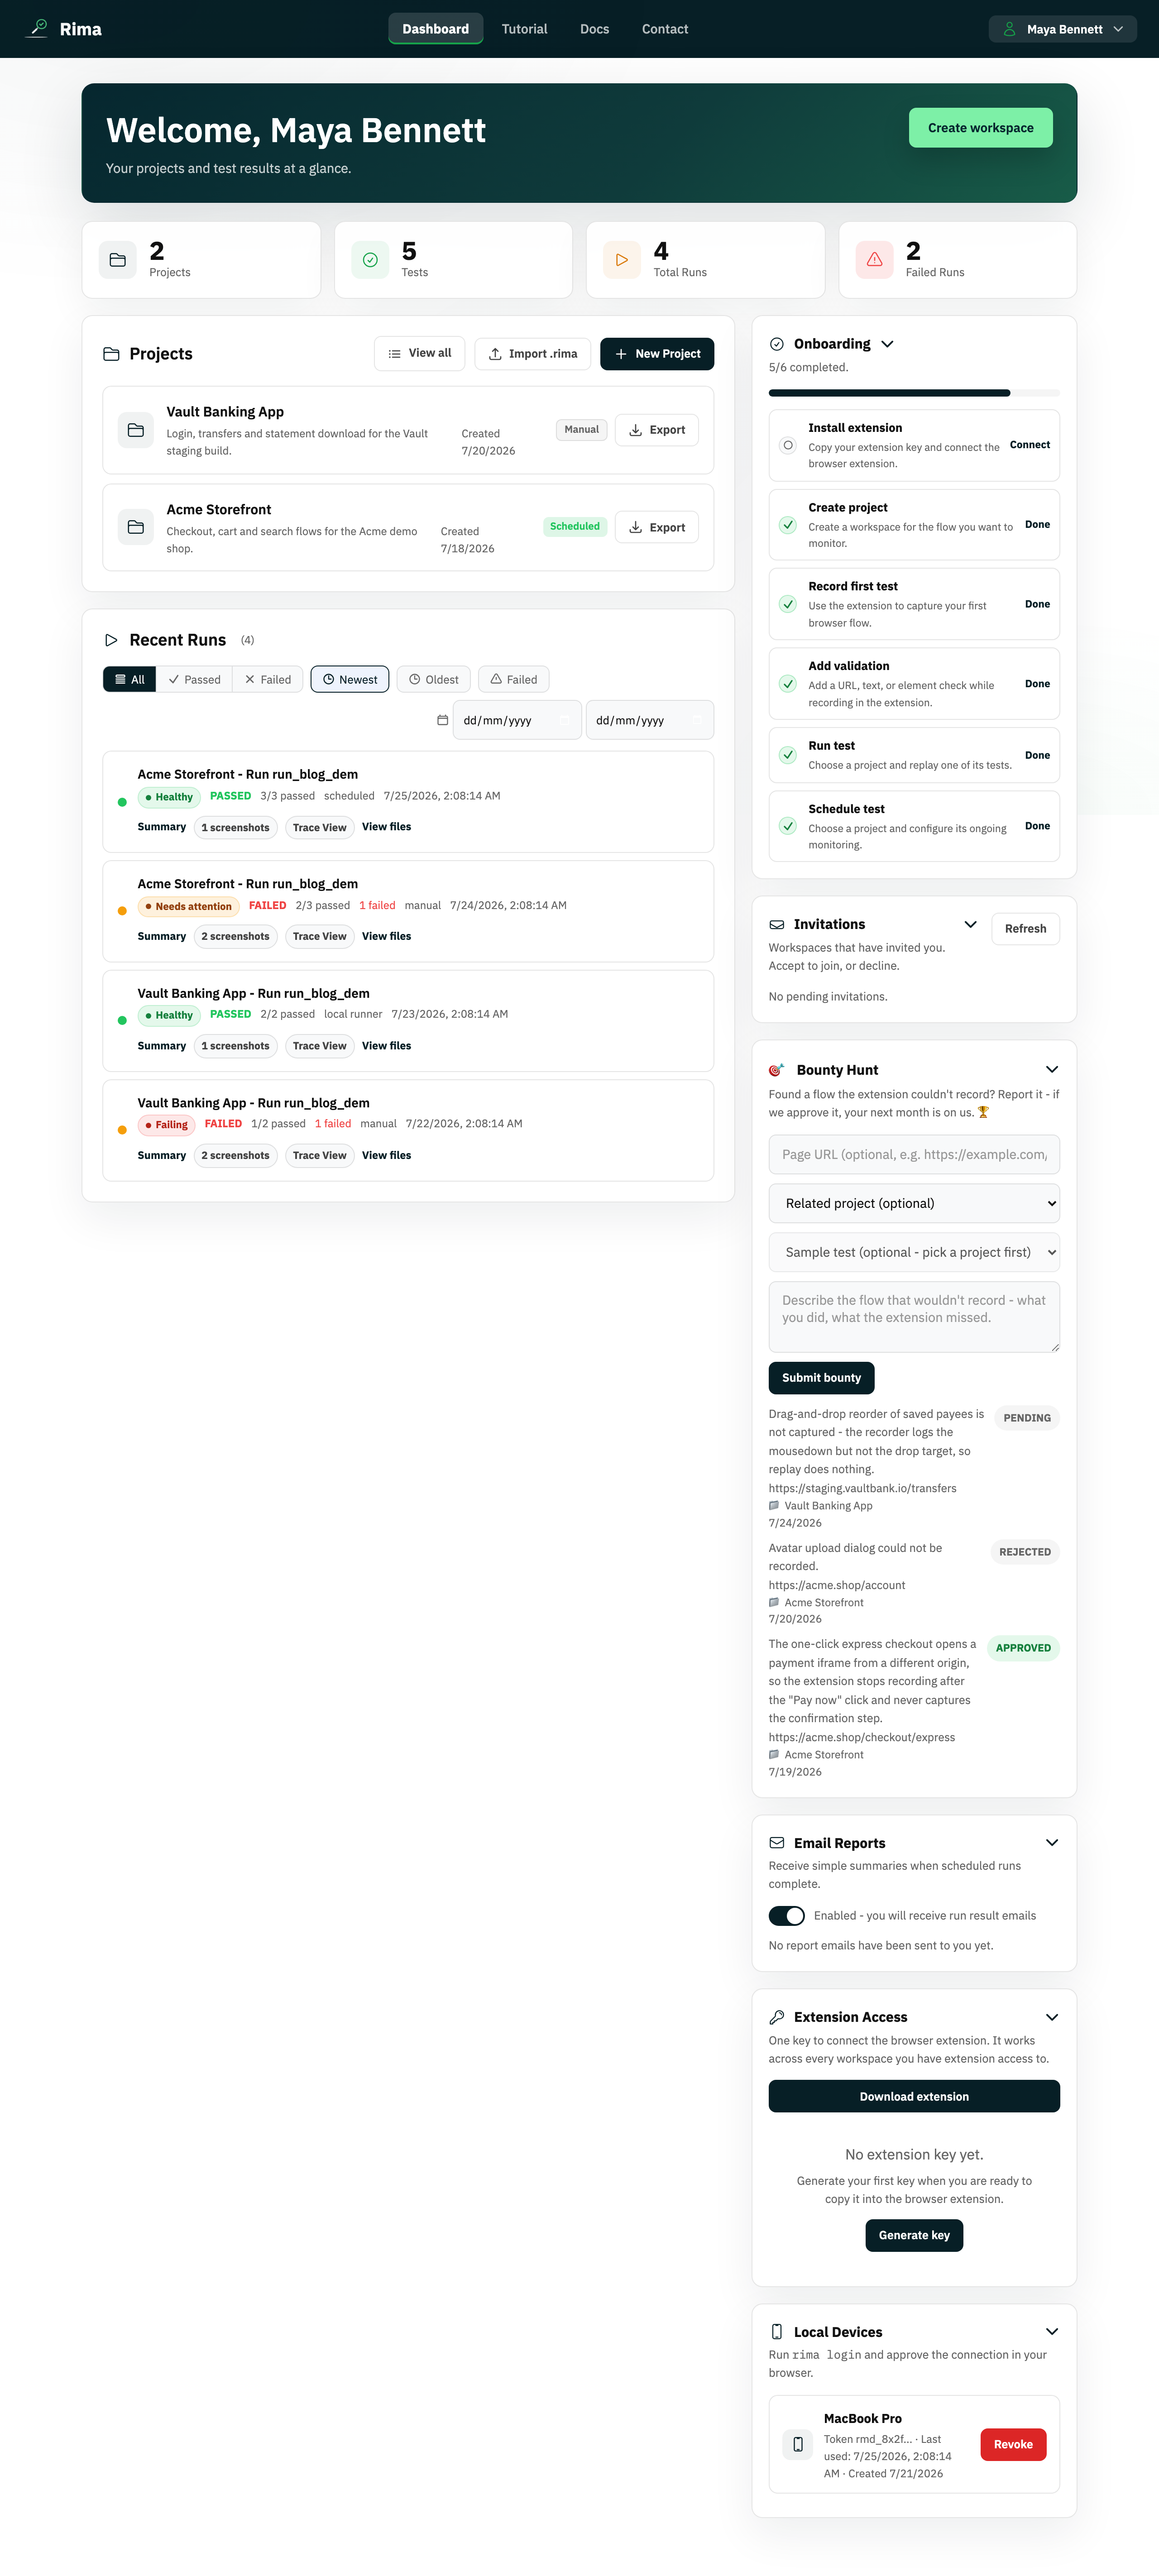
The numbers at the top
Four counters summarise the active workspace: how many projects you have, how many tests are saved inside them, how many runs have executed in total, and how many of those runs failed. They update as you work.

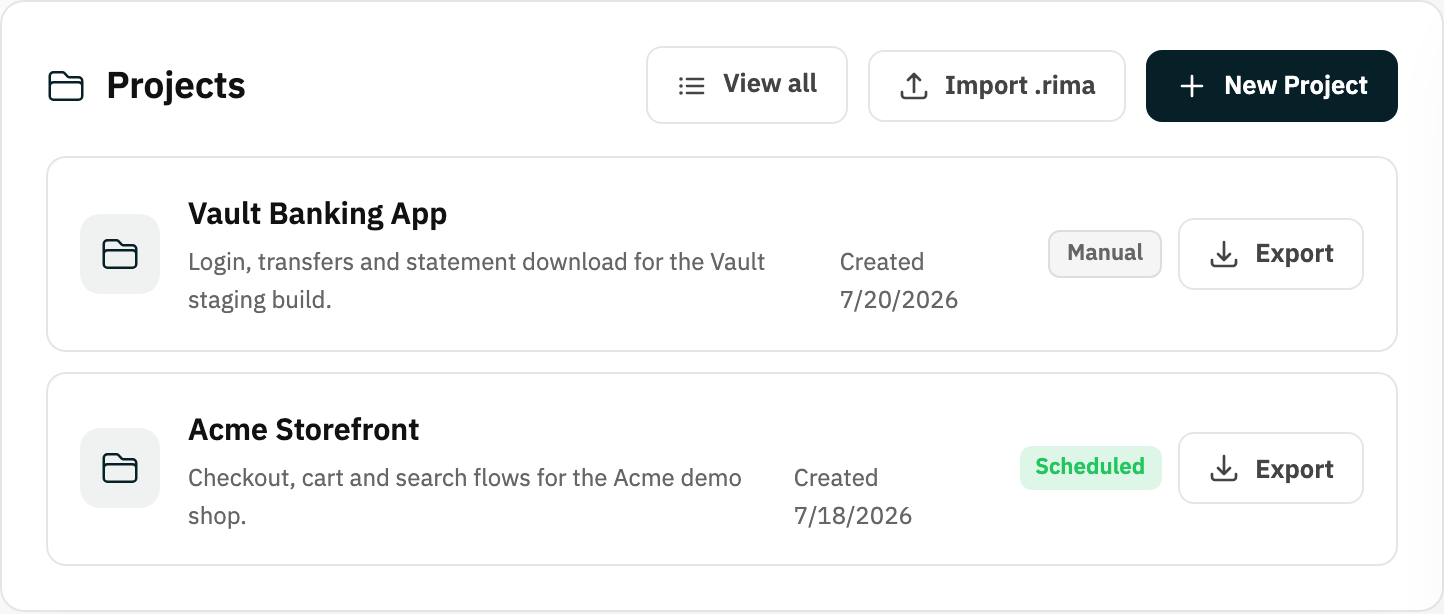
Projects panel
The projects card lists every project you can access. You can search projects by name, change the sort order, and choose how many appear per page. From here you can also create a new project, import a project from an encrypted .rima file, export one, or run a saved test group straight from a project card.
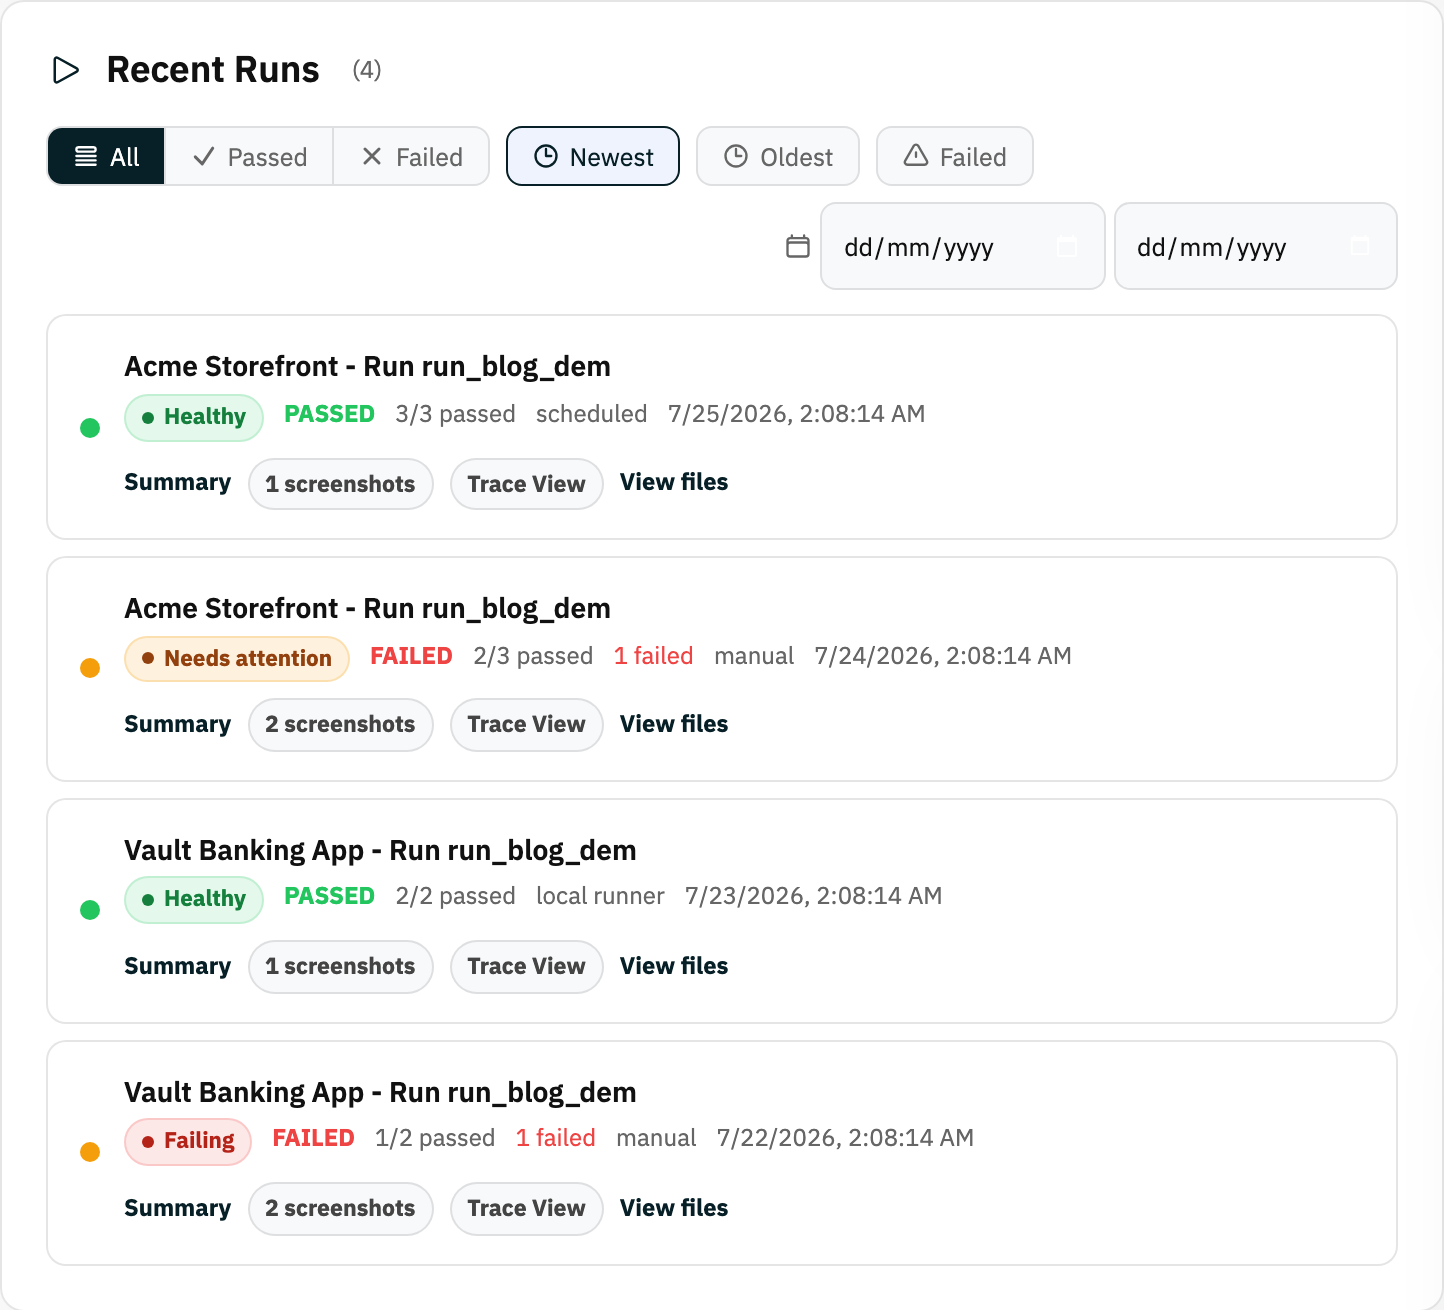
Recent runs
The run history card shows your latest test runs. Filter them by status (passed, failed and so on), by date range, sort them, and page through older runs. Click any run to open its full summary.
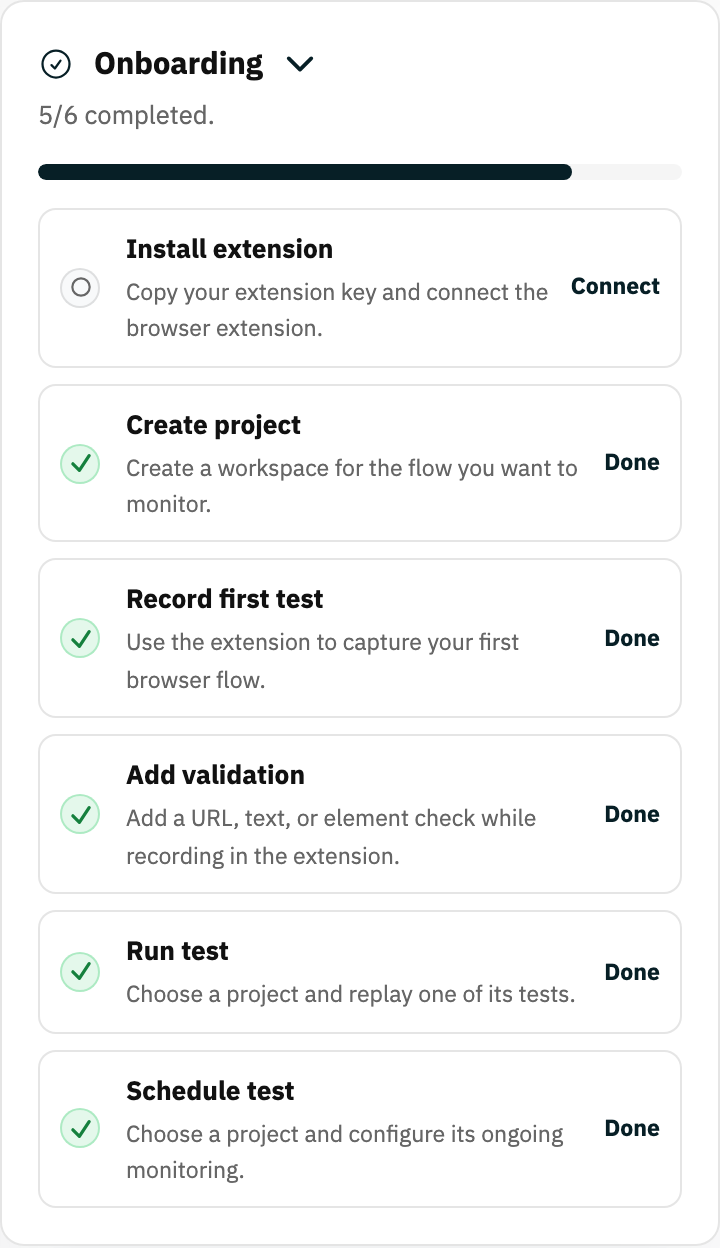
Onboarding checklist
New accounts see a checklist that tracks your setup progress - create a project, connect the extension, record a test, run it. Each item links directly to the place where you complete it, so it doubles as a guided tour.
Side panels
The column of panels beside the main content holds the tools you reach for occasionally. Every panel can be collapsed or expanded so the dashboard stays tidy:
- Browser extension token - view the key that links the Chrome extension to your account, rotate it, and copy the new one.
- Local devices - create a short-lived device code for the CLI, copy the login command, see connected devices, and revoke any of them.
- Team members - a preview of who is in the workspace, plus invite, resend and revoke controls.
- Bounty reports - report a flow the recorder could not capture and track the reward status.
- Email notifications - switch run-result emails on or off and preview recent report emails.
Banners you may see
A trial banner shows your free-trial or subscription status and links to billing when action is needed. An invitation banner appears when someone invited you to their workspace - accept or decline from the dashboard, and refresh the list any time.
Ready to try it yourself?
Create your free account, record your first flow, add a validation, and let Rima run it on a schedule for you.
Start free trial